3. Raster vs Vector analysis#
The analysis can be performed adopting two frameworks, either a raster-based or a vector-based one.
Raster analysis#
Raster analysis has the advantage of working uniquely with gridded data, as also travel/friction surfaces are used apart from gridded population and flood maps. The major advantage of this analysis, after having properly scaled and adjusted the resolution of the datasets, fast numerical computations can be performed, allowing the assessment of large datasets with relatively little resource consumption. Additionally, this raster approach can be easily integrated with additional gridded data (e.g., wealth), and the complexity of the analysis is limited compared to the consideration of a vectorized road network. The drawback of this approach is that the highest precision of the analysis that could be achieved corresponds to the resolution of the travel friction dataset, usually 100m, therefore lacking a street level assessment of flood disruption. In this framework, flood disruption is considered by weighting the travel friction surface according to the flood depth value of the flood hazard map.
Based on the work of [], the motorized travel time is slowered following the flood depth disruption function shown below:
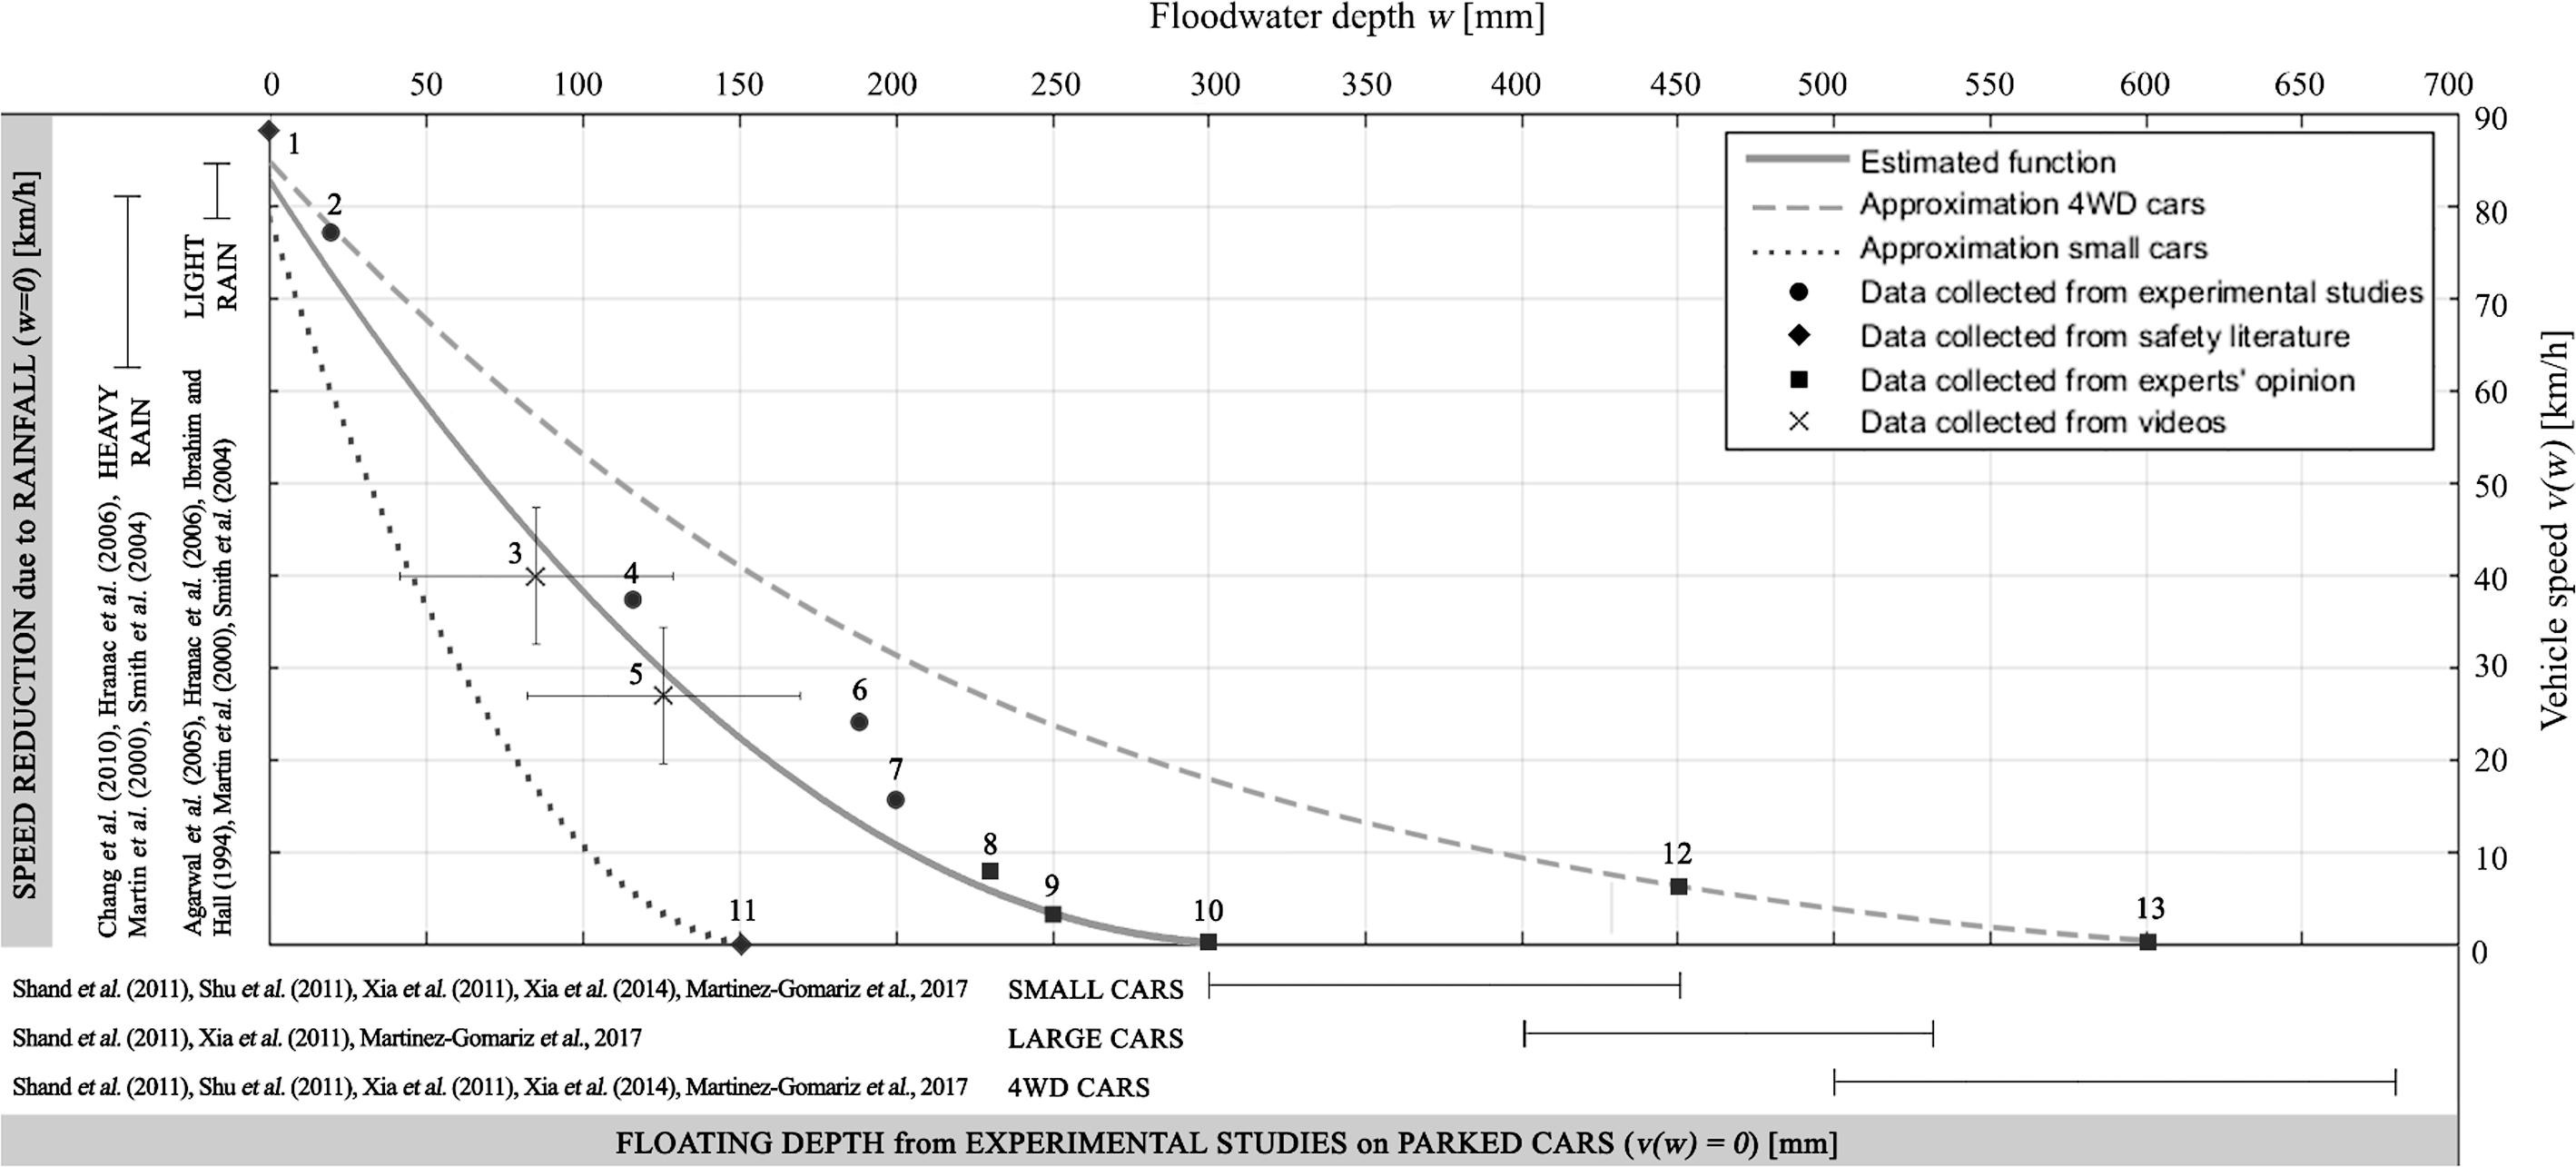
The application of this function is more accurate than the adoption of a simple threshold-based disruption approach, as it allows to build weights used for disrupting the travel time of the friction surface according to Flood Depth:
If FD = 0, the weight is 1;
If FD > 30, the weight is 50;
If FD > 0 & FD < 30 the weight is between 1 and 20, according to the inverse of quadratic function shown in the Figure above.
By multiplying the friction surface for the weights generated, we obtain a disrupted travel time and accessibility estimation.
This is achieved using the friction_flood_weight function of the PAM_toolkit.
The raster analysis allows for retrieving the following indicators:
Population share within 2 hrs from the nearest Health Facility
Population share within 2 hrs from the nearest Hospital
Aggiungere i passaggi utilizzati di calcolo per la raster analysis
Vector analysis#
Vector analysis is based on the usage of a vectorized road network to represent connectivity and assess accessibiilty compared to the travel friction surface. The biggest advantage of this approach is that it allows for a precise, street-by-street asessment of the flood impacts on the road network, and therefore permits a real-world comparison of the sensitivity of physical accessibility to extreme flood events. Considering the road network permits to investigate not only flood impacts on countries, but also within cities impacts, supporting the identification of most important escape routes and sensitive streets to flood events. This precision, however, comes at the cost of high time requirements for performing the analysis, especially if large areas are considered.
Using the vectorized road network, flood disruption is considered by applying a simple treshold-based approach, where 20 cm are necessary for disrupting the road accessibility (excluding bridges).
In order to do this, a two step procedure is needed:
[Vectorization] Flood maps are converted from a raster gridded dataset (stored in rasterio) to a vector-based polygon dataset (stored in geopandas), with each previous cell now corresponding to a box shapely geometry.
This allows to preserve the street-level detail os the OSM road network as well as the original resolution of the flood datasets.[Intersection] The vectorized flood GeoDataFrame is intersected with the OSM road network, checking, for every geometry (i.e., road), if this overlaps with one of the flood cell geometry.
These two tasks are computed using the flood_disruption_roads function of the PAM_toolkit. The vector analysis allows for retrieving the following indicators:
Health Facilities share with direct access (<100m) to an all season road
Health Facilities share within 2km from an all season road
Aggiungere i passaggi dei calcoli utilizzati per la vector analysis